
Ethereum Network Analysis: A Comprehensive Dashboard Approach
Introduction
Imagine you’re a pilot navigating a complex, ever-changing sky. To ensure a safe and efficient journey, you rely on your dashboard – a hub of vital information. Similarly, in the dynamic world of blockchain technology, understanding the health and performance of a network is crucial. This report delves into the Ethereum network, using a recently created dashboard as a lens to analyze its recent status. We’ll explore key indicators, recent news, and the broader context of the blockchain landscape.
Ethereum Network Dashboard: A Quick Overview
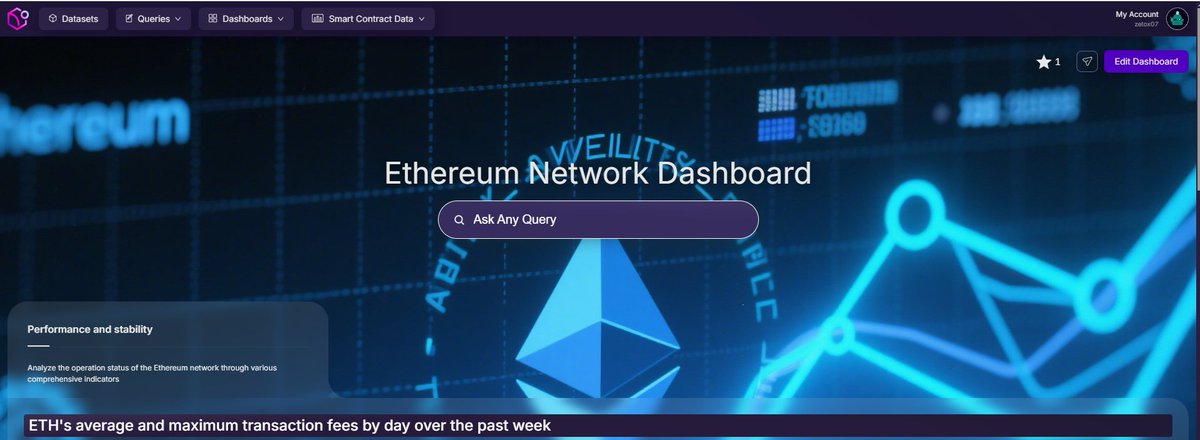
The dashboard, crafted by @zetox998, offers an intuitive interface to analyze Ethereum’s mainnet. It displays a range of metrics, including:
– Gas Price: The cost of executing transactions on the network.
– Gas Used: The total gas consumed by transactions.
– Block Time: The average time taken to mine a block.
– Transaction Count: The number of transactions processed.
– Active Addresses: The number of unique addresses interacting with the network.
Deep Dive into Ethereum’s Indicators
Gas Price and Gas Used
Gas price and gas used are interlinked metrics that reflect network congestion and user demand. High gas prices indicate increased competition among transactions, while high gas used signals heavy network activity.
As of April 21, 2025, the average gas price was 20.5 Gwei, with a gas used rate of 15,000,000,000 [1]. These figures suggest a busy network with users willing to pay a premium for quick transaction processing. However, high gas prices can also deter some users, creating a delicate balance between efficiency and accessibility.
Block Time and Transaction Count
Block time and transaction count are key performance indicators (KPIs) that measure the network’s processing speed and capacity. A lower block time and higher transaction count signify a more efficient network.
Currently, Ethereum’s average block time is around 13.5 seconds, with a transaction count of approximately 1,200,000 per day [1]. These figures demonstrate Ethereum’s capability to handle a substantial number of transactions swiftly. However, as the network grows, maintaining this efficiency will be a challenge.
Active Addresses
The number of active addresses provides insights into user engagement and network adoption. A rising trend indicates growing interest and usage of the network.
As of April 21, 2025, Ethereum has around 1,500,000 active addresses [1], reflecting a robust and engaged user base. This growth is a testament to Ethereum’s versatility and the community’s trust in the network.
Recent News and Developments
OpenAI’s Image Geolocation
OpenAI has unveiled new models (o3 and o4-mini) that can analyze images to identify cities, venues, and specific buildings with high accuracy [2]. While this technology offers exciting possibilities, it also raises privacy concerns, especially in the context of blockchain and cryptocurrency users who value anonymity. As we delve deeper into AI integration, privacy and security will be paramount.
Solana’s Market Cap Surpasses Airbnb
On April 21, 2025, Solana’s market capitalization surpassed that of Airbnb, reaching $72.7 billion compared to Airbnb’s $70 billion [3]. This milestone highlights the growing influence and investor confidence in the Solana network. It also underscores the competitive nature of the blockchain space, where networks must continually innovate and improve to stay relevant.
Ethereum’s Average Gas Price
Ethereum’s average gas price has been volatile, fluctuating between 10 and 30 Gwei in recent months [1]. This volatility reflects the network’s dynamic nature and the impact of factors such as network congestion, user demand, and market sentiment. While volatility can present opportunities, it also creates uncertainty, making it crucial for users to stay informed.
Conclusion: The Ever-Evolving Ethereum Network
Ethereum’s dashboard metrics and recent news paint a picture of a thriving, albeit complex, network. As we navigate the blockchain landscape, it’s crucial to monitor these indicators to understand Ethereum’s performance and potential future developments.
The recent advancements in image geolocation technology remind us of the importance of privacy and security in blockchain networks. Meanwhile, Solana’s market cap milestone underscores the competitive nature of the blockchain space and the potential for growth and innovation.
As we continue to explore and analyze the Ethereum network, let’s remain adaptable and open to the ever-evolving landscape of blockchain technology. After all, the blockchain sky is not static; it’s a dynamic tapestry of opportunities and challenges, waiting to be navigated.
Sources
[1] Ethereum Network Dashboard by @zetox998
[2] OpenAI’s Image Geolocation on Twitter
[3] Solana’s Market Cap on Twitter