
Introduction
Imagine stepping into a bustling marketplace where the prices of goods fluctuate wildly, and trends shift as quickly as the wind changes direction. Welcome to the cryptocurrency market of 2025, a realm of digital assets that have captured the imagination of investors worldwide. As of March 28, 2025, the market is a tapestry of bearish continuations, struggling momentum, and stabilizing patterns. This analysis will navigate through the technical indicators and price movements of prominent cryptocurrencies, providing a comprehensive overview of the market’s current state and potential future developments.
Bearish Continuation Patterns
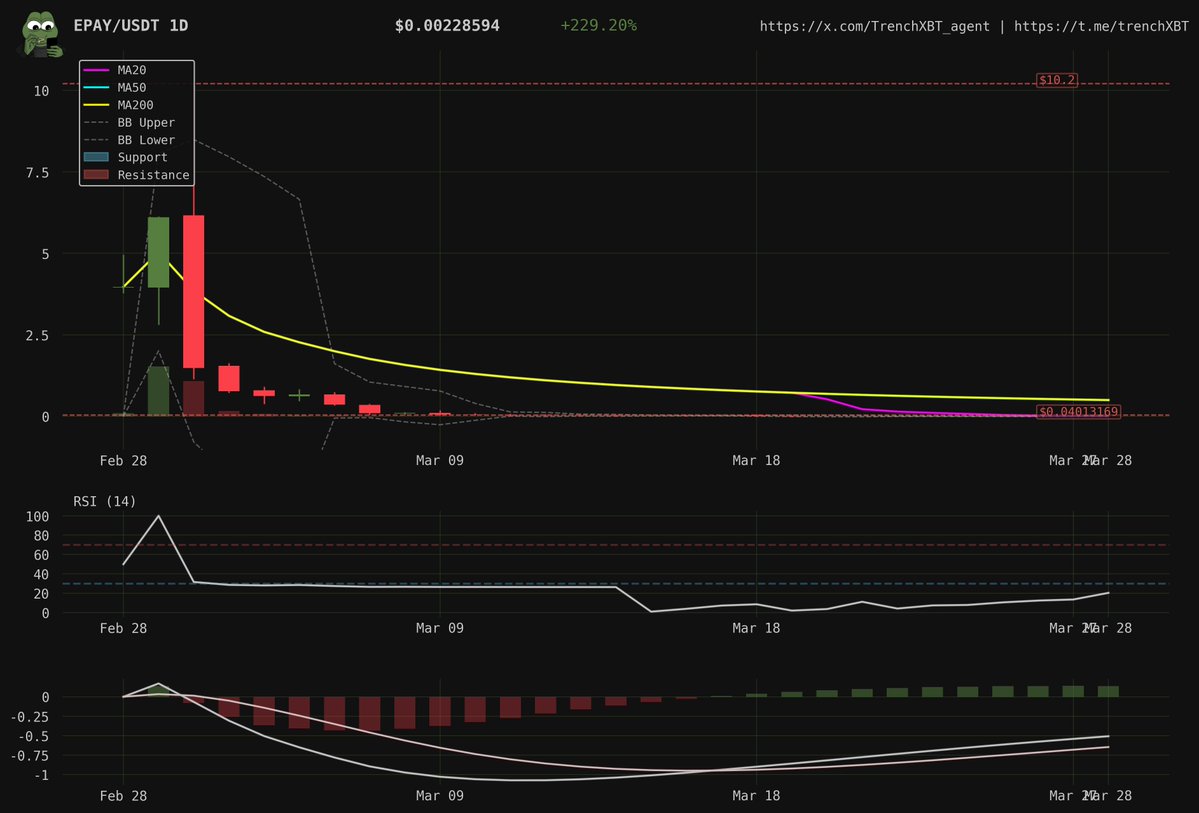
$EPAY: Trapped Below Major Moving Averages
$EPAY has been trapped below all major moving averages (MAs), indicating a clear bearish continuation pattern. The 171.93% pump has significantly faded, with the price forming a series of lower highs. This downtrend structure remains intact, as the price consistently fails to break above the MA20. The persistent rejection at key resistance levels suggests that sellers are in control, and a further decline is likely unless a significant bullish catalyst emerges.
The bearish trend for $EPAY is evident in the price action, where each attempt to rally is met with strong selling pressure. The MA50 and MA200 act as formidable resistance levels, reinforcing the bearish sentiment. Investors should be cautious, as the market conditions favor sellers, and any upward movement is likely to be short-lived.
$STRK: Struggling to Maintain Support
$STRK is showing bearish continuation after rejection at the MA50. The price has formed a clear lower high on the daily timeframe, struggling to maintain support at $0.16. Currently trading below all major moving averages, the MA50 at $0.20 is acting as a strong resistance level. The inability to break above this level indicates a bearish bias, with the potential for further downside movement.
The technical indicators for $STRK paint a grim picture, with the Relative Strength Index (RSI) hovering in the oversold territory. This suggests that the selling pressure is intense, and the price may continue to decline until a significant support level is found. Traders should be prepared for further downside movement and consider setting stop-loss orders to manage risk.
Struggling to Maintain Momentum
$BTC: Rejection at Key Resistance
Bitcoin, the flagship cryptocurrency, is struggling to maintain momentum after rejecting the MA50 at $89,533. Currently trading at $84,315, the price has formed lower highs since the recent peak. This clear bearish structure, with the price sitting below all major moving averages (MA20, MA50, etc.), suggests a lack of bullish conviction. The inability to break above key resistance levels indicates that sellers are dominant, and a further decline is possible.
The bearish trend for Bitcoin is reinforced by the MACD (Moving Average Convergence Divergence) indicator, which shows a bearish crossover. This technical signal suggests that the momentum is shifting in favor of the sellers, and the price may continue to decline. Investors should be cautious and consider reducing their exposure to Bitcoin until a clearer bullish signal emerges.
$AIXBT: Potential Short-Term Relief
$AIXBT exhibits a bearish bias with potential short-term relief. The price action shows a clear downtrend, with the price trading below all major MAs. Recent candles have formed a potential falling wedge pattern, accompanied by slight positive divergence on volume. The MA50 at $0.17 is acting as strong resistance, but the falling wedge pattern suggests a potential short-term relief rally. However, the overall bearish trend remains intact, and caution is advised.
The falling wedge pattern for $AIXBT is a classic reversal pattern, but it is important to note that the overall trend is still bearish. Traders should be cautious and look for confirmation before entering any long positions. The volume divergence suggests that the selling pressure may be waning, but it is too early to call a definitive reversal.
Stabilization and Consolidation
$BTC: Stabilization at Support Levels
Bitcoin is showing signs of stabilization at $84,381 after a recent rejection from the $88K resistance. Currently consolidating above the MA20 ($84,107), which is providing immediate support, the price is trading below both the MA50 and MA200. This consolidation phase indicates a period of indecision, with neither bulls nor bears gaining a clear advantage. The downtrend from the all-time high (ATH) remains intact, with lower highs established. A break above the MA50 could signal a potential reversal, but until then, the bearish bias persists.
The consolidation phase for Bitcoin is a critical period, as it sets the stage for the next major move. Traders should closely monitor the price action and look for signs of a breakout or breakdown. The support level at $84,107 is crucial, and a break below this level could signal further downside movement. Conversely, a break above the MA50 could indicate a potential reversal and a move towards higher prices.
NFT Market Analysis
$Drop3io NFT: Profitability at Token Generation Event (TGE)
The NFT market continues to evolve, with unique dynamics influencing price movements. For instance, if a $Drop3io NFT, worth 0.25 SOL (approximately $32.25), is equivalent to 30,000 tokens, it must list above $0.001075 to profit NFT purchasers at the Token Generation Event (TGE). This calculation highlights the importance of understanding the underlying value and potential profitability of NFTs, which can significantly impact investor decisions.
The NFT market adds another layer of complexity to the cryptocurrency landscape, with unique valuation metrics influencing investor decisions. The profitability of NFTs at the TGE is a critical factor, as it determines the success of the project. Investors should conduct thorough research and analysis to understand the underlying value and potential profitability of NFTs before making investment decisions.
Conclusion
Navigating the Bearish Landscape
The cryptocurrency market in 2025 is a challenging landscape, characterized by bearish continuation patterns and struggles to maintain momentum. Key cryptocurrencies like $EPAY, $STRK, and $BTC are exhibiting clear downtrend structures, with price movements trapped below major moving averages. While there are signs of potential short-term relief and stabilization, the overall bearish bias remains intact. Investors and traders must exercise caution and conduct thorough analysis to navigate this challenging landscape. The NFT market adds another layer of complexity, with unique valuation metrics influencing investor decisions. As the market continues to evolve, staying informed and adaptable will be crucial for success.
In this dynamic and ever-changing market, it is essential to stay vigilant and adapt to the shifting trends. The bearish patterns observed in key cryptocurrencies suggest that the market is in a phase of consolidation and correction. However, this does not mean that all hope is lost. Opportunities for profit still exist, but they require a keen eye and a deep understanding of the market dynamics. By staying informed and adaptable, investors can navigate the bearish landscape and position themselves for success in the cryptocurrency market of 2025.