
Crypto Market Insights: A Multifaceted Analysis of Bitcoin (BTC) on March 24, 2025
Introduction
In the ever-evolving landscape of cryptocurrency, understanding market trends and patterns is like reading tea leaves, where each swirl and splash reveals a snippet of the future. As of March 24, 2025, Bitcoin (BTC), the OG of all cryptocurrencies, finds itself in a state of limbo, with traders and analysts offering a smorgasbord of interpretations. Let’s dive into the multifaceted analysis of BTC on this day, drawing insights from various sources to create a vivid, 360-degree picture.
The Bullish Narrative: Engulfing Patterns and Ascending Triangles
Bullish Engulfing and Rising Wedges
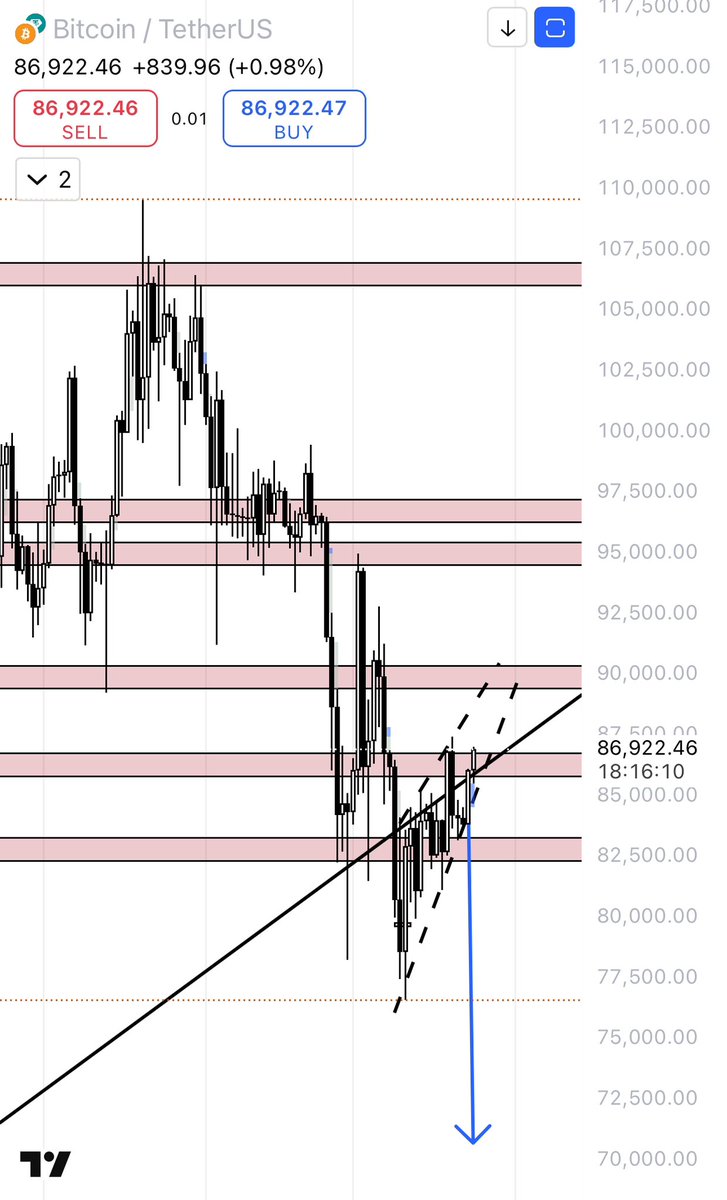
@crypto_trad1ng points out a bullish engulfing pattern on the daily chart, with BTC closing above the uptrend line. This pattern is like a bullish flag being planted in the ground, suggesting a potential trend reversal. However, a rising wedge pattern is also forming, which is typically a bearish reversal pattern. It’s like the market is playing a game of tug-of-war, with bulls and bears locked in a dead heat.
Ascending Triangles and Ichimoku Clouds
@coingape_daily and @CoinGapeMedia both highlight that BTC is bouncing off an ascending triangle support, with the Ichimoku Cloud signaling bullish momentum. Ascending triangles are like trampolines for the price, suggesting the current trend will resume once the price breaks out of the triangle. The Ichimoku Cloud, a versatile indicator that defines support and resistance, as well as trend direction, is cheering for the bulls in this instance. A breakout with substantial volume could send BTC soaring like a rocket, according to these sources.
The Bearish Counterpoint: Weak Indicators and Short Setups
On-Balance Volume (OBV) and Relative Strength Index (RSI)
@crypto_trad1ng also notes that the On-Balance Volume (OBV) is showing weak volume, and the Relative Strength Index (RSI) is bullish, but not overly so. These indicators suggest that while there is some buying pressure, it’s not enough to drown out the bears, and the market may be vulnerable to a rain shower.
Short Setups and Resistance Levels
@MandaCoin_X shares a 15-minute chart analysis, identifying a short setup for BTC/USDT. This analysis suggests that BTC may hit a wall at certain levels, making it a good time for traders to consider short positions. Additionally, @neoweka provides a long/buy entry point for AUDIO/USDT, with a target price significantly higher than the entry point, indicating a potential opportunity for long positions.
Conclusion: Market Indecision and Opportunity
Navigating the Market Maze
The multifaceted analysis of BTC on March 24, 2025, reveals a market that’s stuck in the mud, with bullish and bearish signals cancelling each other out. This situation presents both challenges and opportunities for traders, as the market’s next move is anyone’s guess. To navigate this market maze, traders must keep their eyes peeled, watching price action and key indicators like a hawk, and be ready to change their strategy on a dime.
Sources